This post contains affiliate links. This means that when you make a purchase, at no additional cost to you, I will earn a small commission.
When it comes to addition, subtraction, multiplication, division, fractions, place value… etc. we ALWAYS start with hands-on materials and math manipulatives.
But is that always the case with graphing? These 3 hands-on graphing activities will boost your students’ understanding of data and graphing in a big way!

Hands-On Graphing Activity #1: Mini Eraser Pictograph
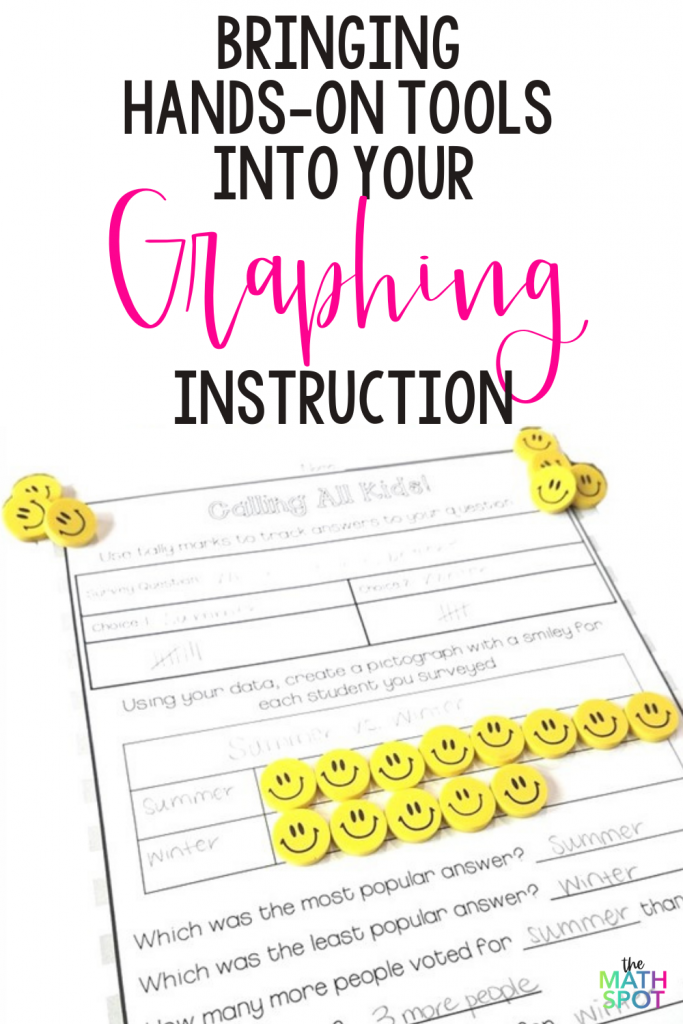
Do your students understand that each picture in a pictograph stands for a specific piece of data? I love using mini-erasers for graphing because not only are they hands-on, the images can also match the context of the graph being created!
After your students create a pictograph using mini erasers, ask them to draw a matching pictograph to represent their data.
Ready to up the complexity? To show that each mini eraser represents, for example, 2 people, ask a small group of students to line up with each set of 2 sharing and holding onto a mini eraser together. Have an unpaired student? Cut the eraser in half!
Again, ask your students to draw a pictograph that matches the model created by the line of students to connect this physical activity with a traditional drawn pictograph.
Each of these hands-on graphing activities will illuminate and bring clarity to pictographs.
Hands-On Graphing Activity #2: Linking Cube Bar Graph
Creating a graph is only the first hurdle when it comes to creating and interpreting data. Reading the graph and having the ability to answer questions about the information adds another layer of complexity.
Answering comparison questions about a set of data is notoriously difficult for elementary aged students. Using a hands-on manipulative such as linking cubes makes this activity easier to understand!
The first step is to ground your students in comparison language. Next, you will turn comparisons into hands-on graphing activities by asking students to build towers of linking cubes to match the data they see in a graph. Ask students which tower has more cubes, which has fewer linking cubes, and if they can line the towers up next to one another to see exactly how many more or fewer exist.
Hands-On Graphing Activity #3: Line Plot Measurement
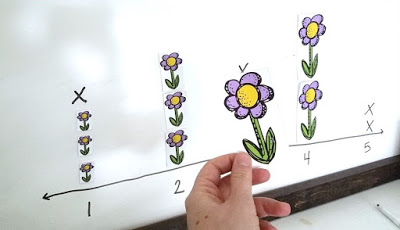
For my students, one of the most difficult parts of understanding line plots was understanding that each x stood for a specific item that had been measured. Creating a line plot of these actual, specific, measured items and then replacing those measured items with an “X” was a game-changer in terms of student understanding.

In the example above, students measured a set of flowers and then placed each flower onto the line plot according to it’s size. One at a time we removed the flowers, replacing the image with a simple “x”. This brought to life the information contained in each “x” on the line plot for my students.
Next time you are starting a graphing or data unit, stop first to think about how hands-on graphing activities might bring the data to life for your students!


