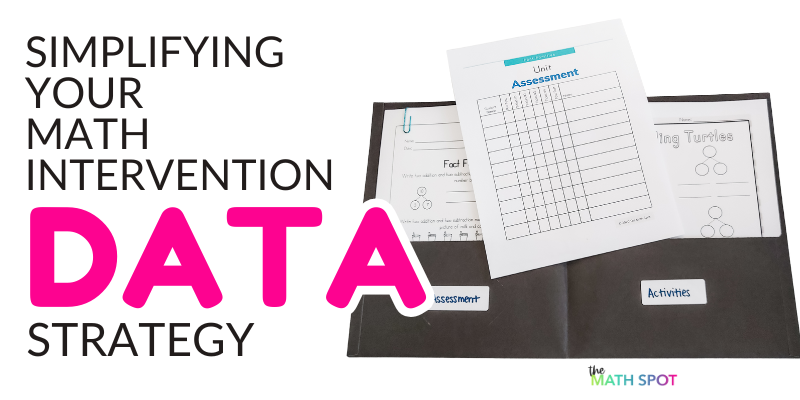
Collecting data for math intervention does not need to be complicated. What you need is a simple framework that gives you the right information at the right time so you can make strong instructional decisions and confidently advocate for your students. A combination of screening assessments, diagnostic assessments and progress monitoring will get the job done!

Step 1: Gather Grade Level Data
The first step in building your math intervention plan is looking at grade level data for all students. This is your “big picture” view and can include:
- District or schoolwide screening assessments
- Report card grades
- Teacher observations
- Unit or module assessments
- Other Tier 1 data collected for the whole class
This data helps you identify students who are at risk and may need math intervention. You can compare performance relative to grade level standards and peers, and you can spot trends that might indicate a need for additional support.
Grade level data is also your advocacy tool. When you attend grade level meetings, student support meetings, or conferences, this is the data you use to show whether students are consistently meeting, approaching, or falling short of standards.
By itself, grade level data tells you who might need intervention. The next step is to figure out where to start with each student.
Step 2: Use a Diagnostic Assessment to Find the Starting Point
Before you dive into strategy lessons or fluency work, take time for a math intervention diagnostic assessment in numbers and operations. This is a targeted assessment designed to:
- Identify what the student already knows
- Pinpoint the next best instructional step
- Map the student’s current place on a developmental continuum of skills
- Track movement along that continuum over time
Unlike a screener, a diagnostic assessment is not a “test everything” approach. You are not measuring every possible skill. Instead, you are using student responses to zero in on the exact point in the continuum of numbers and operations where they are secure, then determining the next skill they are ready to learn.
This step ensures that your intervention time is spent on instruction that is matched to each student’s needs. It also gives you a clear picture of progress as students move from one level of the continuum to the next.
If you are in need of an assessment that will help you to zone in on the range of numbers and operations your students are working in this assessment is a useful tool.
Step 3: Monitor Student Data in Two Key Areas
Once you know where to start, you will track student data in two key areas:
Strategy Work
Strategy work is focused on the targeted skills you are addressing in math intervention lessons. I recommend using a pre-assessment and post-assessment for each unit or skill. These assessments should directly mirror each other so growth is easy to see and explain.
This data serves two purposes. First, it is powerful advocacy evidence. If you have eight students in a group and seven show significant growth while one does not, you have concrete proof that one student may need a higher level of support.
Second, it helps you make instructional decisions. If half the group struggles on a post-assessment, you know you need to spend more time on that skill before moving ahead. To avoid surprises, I also use daily exit tickets aligned to the intervention skill. This allows you to adjust instruction in real time so all students stay on track.
Fact Fluency Work
Fluency work focuses on building efficient, accurate, and flexible recall of basic facts. I keep data on fluency growth over time, even when fluency instruction is embedded within strategy lessons.
This data is useful for advocacy—showing progress toward fluency goals—and for tailoring instruction. By looking at the facts and strategies a student is using, you can target instruction to strengthen specific fact relationships and improve overall fluency.
Bringing It All Together
The process is straightforward:
- Start with grade level data to identify students for intervention.
- Use a diagnostic assessment to determine their starting point in numbers and operations and the next step forward.
- Track student data in strategy work and fluency work to guide instruction and show growth.
With this approach, you always know who needs support, where to start, what to teach next, and how to demonstrate progress.
Math Intervention Resources From The Math Spot


